
Trading online can feel overwhelming when you’re first learning how markets move. Understanding how to read price charts and identify market trends can help you make more informed decisions and build confidence over time.
If you’re a beginner, here’s a guide that can help you familiarise yourself with the fundamentals so you can be clear about the market and make more informed decisions while trading online.
How to Read Candlestick Charts
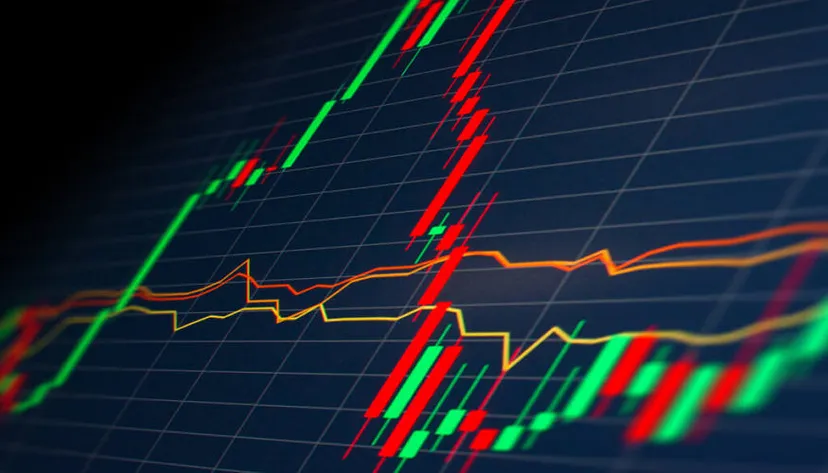
One of the most important things to understand as a beginner trader is how to read a candlestick chart, as this is one of the most widely used tools for analysing market activity. Candlestick charts help traders visualise price movements and market sentiment over a specific period, making it easier to identify trends and potential turning points.
Many traders also use platforms such as TradingView to monitor candlestick patterns, compare different timeframes, and track price movements in real time. However, these tools become far more useful once you understand what the charts are actually showing you.
Candlestick diagrams reveal four key pieces of information about market activity within a specific timeframe:

● Open – the price at which the asset started trading during that timeframe
● Close – the price at which the asset finished trading when the timeframe ended
● High – the highest price reached during that period, shown at the top of the wick
● Low – the lowest price touched during that period, shown at the bottom of the wick
If the candle closes higher than it opened, buyers pushed prices upward during that session, which is often displayed as a green candle. If the candle closes lower than it opened, sellers were in control and prices moved downward, which is usually shown as a red candle.
Over time, traders use these patterns to better understand momentum and market sentiment. For example, a series of strong bullish candles may suggest growing buying pressure, while smaller candles or long wicks can indicate uncertainty and increased market volatility.
Understanding Support and Resistance Levels
In trading, there are support and resistance levels, which essentially refers to the floor and ceiling of the market. These levels determine supply and demand, so recognising where the line sits is crucial for making decisions in real-time.
- Support (the floor) – everyone wants to buy stock at a certain price. Buyers see the assets as a bargain at that moment and sellers are reluctant to part with it at such a low price, building a concentration of buying power that creates support. This level of demand stops stock falling further.
- Resistance (the ceiling) – when prices climb, sellers rush to make a profit and buyers become hesitant to buy an expensive looking asset, creating a supply that’s strong enough to stop stock moving higher.
When a price eventually forces its way through the ceiling, it typically becomes a new floor price.
Identifying Basic Trends
Markets don’t typically move in a straight line, but you can use charts to figure out the generational direction. There are three main market conditions you need to be aware of:
- The uptrend – prices are generally rising and charts look like a series of peaks and troughs, where each peak is higher than the last and each trough stops at a higher level than the previous dip.
- The downtrend – prices are steadily falling and charts feature lower highs and lower lows.
- The sideways market – prices are bouncing up and down between a relatively fixed high and low point.
Managing the Risks
Understanding how to interpret charts is incredibly beneficial for decision-making, but there’s no guarantee that the market won’t do the exact opposite of what you expect. While you can’t predict the future, you can manage the risks. Do this by:
- Using a stop-loss order – this automated instruction will close your trade if the market moves against you by a specific amount, preventing a small mistake from becoming a catastrophic loss.
- Keeping stakes small – don’t risk more than one or two percent of your total trading account on any single trade.
- Practicing first – open a demo account and trade with virtual funds. You can use this simulated environment to get used to charts and market trends without any financial risk.
Start Your Online Trading Journey
By getting a better grasp on charts, understanding how to identify trends, and knowing how to manage risks, you can build a solid foundation for your online trading journey.